Workbooks: From Purposeful Data to Interactive Decisions
Static dashboards and BI reports often create more questions than they answer. When a business user sees a number, their immediate next step is to ask "why?"—a question that sends analysts back to their tools, creating a slow, frustrating loop between data and decisions.
Arkham's Workbooks are engineered to break this cycle. They are live, interactive dashboards built on a foundation of governed data, allowing users to not only see what's happening but to explore, filter, and ask follow-up questions in real time. By connecting directly to your curated Production Tier Datasets in Data Catalog, and live ML model outputs, Workbooks transform static reports into dynamic decision-making tools.
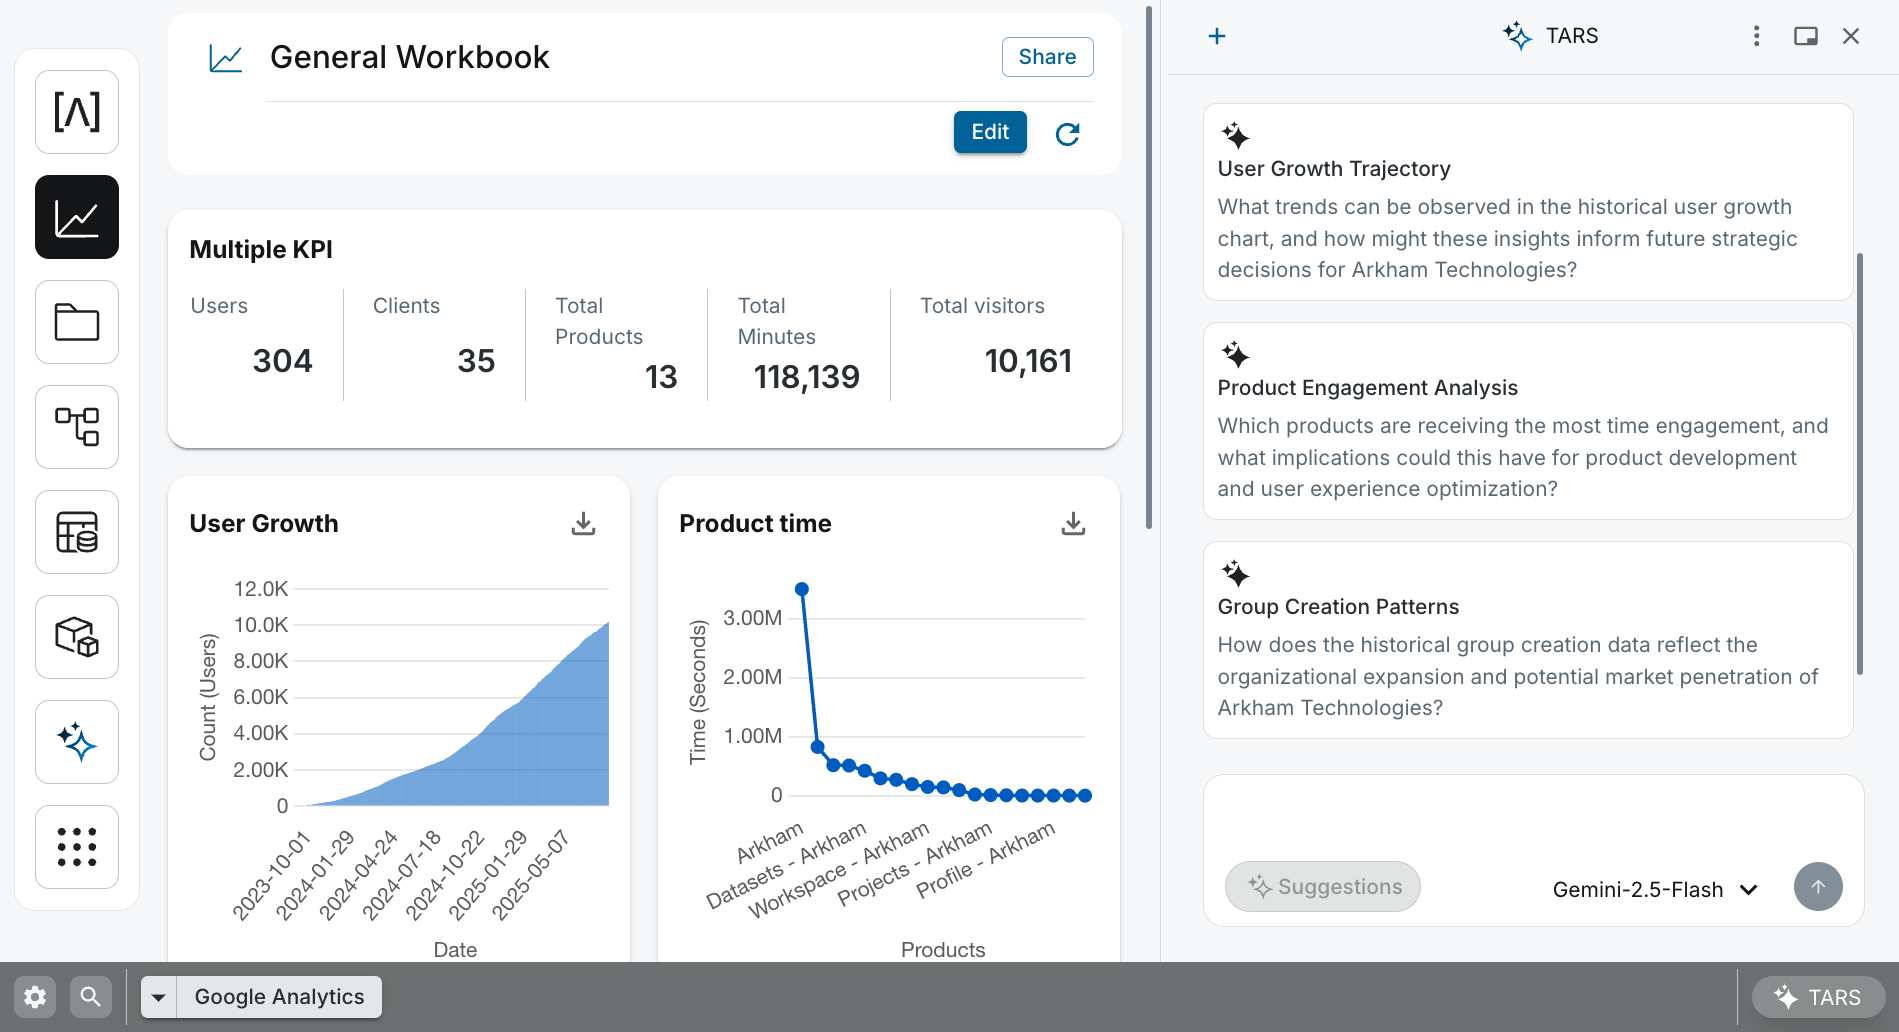 An interactive Workbook dashboard, where live, governed data is transformed into dynamic visualizations for exploration and decision-making.
How They Work: From Governed Data to Visualization
Our key to building a reliable dashboard is ensuring the data comes from a trusted, well-defined source. Workbooks enforce this by design, providing a low-code canvas for visualizing outputs from either the Production Tier in the Data Catalog or the ML Hub.
graph TD
    subgraph "Governed Data Sources"
        A["Data Catalog (Production Tier)"]
        B["Data Catalog (ML Models)"]
    end

    subgraph "Workbook Authoring"
        direction LR
        C["Low-Code Canvas"]
        D["SQL Editor"]
    end

    subgraph "End User Experience"
        E["Interactive Dashboard"]
    end

    A -- "Directly Queried via" --> D
    B -- "Directly Queried via" --> D
    D -- "Populates Panels in" --> C
    C -- "Creates" --> E

    classDef data fill:#FFF8E1,stroke:#FBC02D
    classDef builder fill:#E3F2FD,stroke:#1976D2
    classDef consumer fill:#E8F5E9,stroke:#388E3C

    class A,B data
    class C,D builder
    class E consumer
Our workflow is direct and query driven:
- For Business Intelligence: Our journey begins with a trusted dataset in our Data Catalog. When you add a panel to a Workbooks, a SQL editor slides out, allowing you to directly query the datasets you need (e.g.,
SUM(revenue)). The results of your query then populate the chart or table. - For Model Analytics: Our journey begins in the ML Hub, where you train and deploy a model. Then the model's predictions are available as a source in Workbooks. You can build dashboards to monitor the model's performance over time or create "what-if" scenarios by changing input parameters.
🤖 AI-Assisted Analytics with TARS
TARS acts as an analytical co-pilot directly within our Workbook interface, empowering both builders and consumers to interact with data more intuitively. For Builders: Accelerate dashboard creation by using natural language.
"TARS, create a new KPI panel showing total active_users for the last 30 days from the
@prod_users."
For Consumers: Go beyond the dashboard's static filters. Ask follow-up questions to dig deeper into the data.
"TARS, what was the peak revenue day last month?"
Key Features for Builders
- Low-Code Interface: Build sophisticated dashboards without writing front-end code. Our UI handles panel arrangement, chart configuration, and interactivity.
- Governed Data Sources: By building on top of curated datasets in your Data Catalog, we ensure that all dashboards are governed by a single source of truth.
- Direct Querying: Each panel is powered by a SQL query. This gives you full control over the data you display, from simple aggregations to complex joins.
- Direct Model Integration: Seamlessly visualize the outputs of your deployed ML models. This is critical for monitoring model drift, evaluating accuracy, and explaining results to stakeholders.
- Performance Optimization: Our platform automatically handles query caching to provide a fast user experience, with the option to bypass the cache when real-time data is critical.
Core Components
- Panels: Building blocks of a workbook. Choose from various types including Markdown, KPIs, tables, and a wide range of charts (line, bar, donut, etc.).
- Filters: Control the data displayed in panels. Global filters affect all panels, while Local filters apply to a single panel.
- Edit Mode: The builder-focused interface for configuring workbooks. Change layouts, modify panel types, rename axes, set colors, and define number formatting.
- SQL Editor: When editing a panel, a drawer provides a full-featured SQL editor to write the query that will populate your visualization.
Related Capabilities
- AI Platform Overview: Understand how Workbooks fit into our AI Platform ecosystem.
- Data Catalog: The source of the trusted, production-grade data that powers your BI dashboards.
- ML Hub: Create the deployable models whose outputs can be visualized and monitored in Workbooks.
- TARS: Accelerate dashboard creation and analysis with a conversational AI co-pilot.